To take stock in a group collaboration, I have joined Varun and Graham’s joint project in mapping the quality of street surfaces around New York City. Ultimately deciding on the Tessel platform for [literally] various plug-and-play reasons, we are now polling for data and writing to a CSV file.
Ultimately, the goal of the project would be to assist the city in gaining a readily updated survey of street surfaces to assist efficient allocations of repair teams and resources. At the moment, the Department of Transportation sends survey teams with clipboards around the city to capture this same data. The results are collected slowly, at a fairly high cost, and ultimately are not updated often. The barrier of entry to improve this collection method is fairly low.
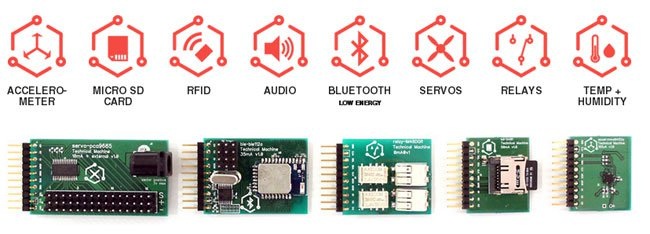
Using the Tessel and its branded accelerometer, GPS, GPRS, and SD card reader modules, we are building a device to be mounted [municipal] vehicles to collect this same data. Vehicles that were already on the road for other reasons will now be doing double duty and collecting useful data for the city!
The following technical considerations have come up in conversation and testing:
Aside from more answers for the above questions, we hope to demonstrate on March 24th a log and map representing data from a ‘test drive’ (bike or car mounted) around a neighborhood. Ideally we will be able to send logged accelerometer and mapped GPS data via the SMS network to a cloud based storage solution. Pulled down off the cloud, we should be able to view this data in GIS capable software for viewing and analysis.
To further study the accuracy of our data, we should do the same ‘test drive’ with a clip board in hand, documenting what we believe would qualify as ‘bumpy’. If our clipboard and data classifications correlate with one another to a high degree, we are on the way to a successful sensor project!
Related Work
There have been a number of studies done in the field of measuring road surface quality using mobile devices and sensors. While researching this area, three studies turned up that are closely related to the work we are seeking to do, although there may be more.
Perhaps the most well-known study, known as the Pothole Patrol (P2), was conducted in 2008 by MIT in Boston [1]. The P2 used a small Linux-based computer, GPS, and accelerometer to collect, filter, and classify road surface anomalies. While the study provided encouraging results, there appears to room for improvement in terms of deciphering between potholes, manhole covers, joint expansions, and railroad crossings, as well as providing ground truth.
Two other studies were conducted by a team of researchers in Italy. The first was to determine if commercially available mobile devices (smartphones, tablets) could be used to detect “bump events” [2]. Similar to the above mentioned study, this was able to reliably detect road surface anomalies, but no work was done to attempt to classify the events. The second study conducted by this group focused specifically on finding the optimal thresholds of vertical impulse measurements to determine a bump event for a variety of smartphones [3]. This may provide us valuable direction when attempting to calibrate our device.
While our project may initially mirror the work done by MIT, we seek to ultimately differentiate our project by collecting and synthesizing image data collected from areas where a road anomaly is detected. This will provide two advantages. First, images may be analyzed using machine learning and aid in the classification of anomalies. Second, it will provide ground truth, so regardless of how an anomaly is classified by our system, manual verification or reclassification can easily be done without requiring someone to physically travel to the location of the anomaly.
Ultimately, the goal of the project would be to assist the city in gaining a readily updated survey of street surfaces to assist efficient allocations of repair teams and resources. At the moment, the Department of Transportation sends survey teams with clipboards around the city to capture this same data. The results are collected slowly, at a fairly high cost, and ultimately are not updated often. The barrier of entry to improve this collection method is fairly low.
Using the Tessel and its branded accelerometer, GPS, GPRS, and SD card reader modules, we are building a device to be mounted [municipal] vehicles to collect this same data. Vehicles that were already on the road for other reasons will now be doing double duty and collecting useful data for the city!
The following technical considerations have come up in conversation and testing:
- What is the best way to categorize a ‘bump’ vs ‘non-bump’? Do we leave this analysis for off board modeling? Off board analysis means we must store and transmit much higher frequencies of data. On board means logic is hard coded and more difficult to tweak or impossible for end users to alter.
- At what point does it prove most efficient to write data to a file or send data to a cloud server?
- How accurate will the GPS data be while a vehicle is moving? Will the GPS ‘timestamp’ left in the file be useful if not completely accurate?
- Will acceleration/deceleration and other vehicle specific movements create too much noise for accurate reading?
Aside from more answers for the above questions, we hope to demonstrate on March 24th a log and map representing data from a ‘test drive’ (bike or car mounted) around a neighborhood. Ideally we will be able to send logged accelerometer and mapped GPS data via the SMS network to a cloud based storage solution. Pulled down off the cloud, we should be able to view this data in GIS capable software for viewing and analysis.
To further study the accuracy of our data, we should do the same ‘test drive’ with a clip board in hand, documenting what we believe would qualify as ‘bumpy’. If our clipboard and data classifications correlate with one another to a high degree, we are on the way to a successful sensor project!
Related Work
There have been a number of studies done in the field of measuring road surface quality using mobile devices and sensors. While researching this area, three studies turned up that are closely related to the work we are seeking to do, although there may be more.
Perhaps the most well-known study, known as the Pothole Patrol (P2), was conducted in 2008 by MIT in Boston [1]. The P2 used a small Linux-based computer, GPS, and accelerometer to collect, filter, and classify road surface anomalies. While the study provided encouraging results, there appears to room for improvement in terms of deciphering between potholes, manhole covers, joint expansions, and railroad crossings, as well as providing ground truth.
Two other studies were conducted by a team of researchers in Italy. The first was to determine if commercially available mobile devices (smartphones, tablets) could be used to detect “bump events” [2]. Similar to the above mentioned study, this was able to reliably detect road surface anomalies, but no work was done to attempt to classify the events. The second study conducted by this group focused specifically on finding the optimal thresholds of vertical impulse measurements to determine a bump event for a variety of smartphones [3]. This may provide us valuable direction when attempting to calibrate our device.
While our project may initially mirror the work done by MIT, we seek to ultimately differentiate our project by collecting and synthesizing image data collected from areas where a road anomaly is detected. This will provide two advantages. First, images may be analyzed using machine learning and aid in the classification of anomalies. Second, it will provide ground truth, so regardless of how an anomaly is classified by our system, manual verification or reclassification can easily be done without requiring someone to physically travel to the location of the anomaly.
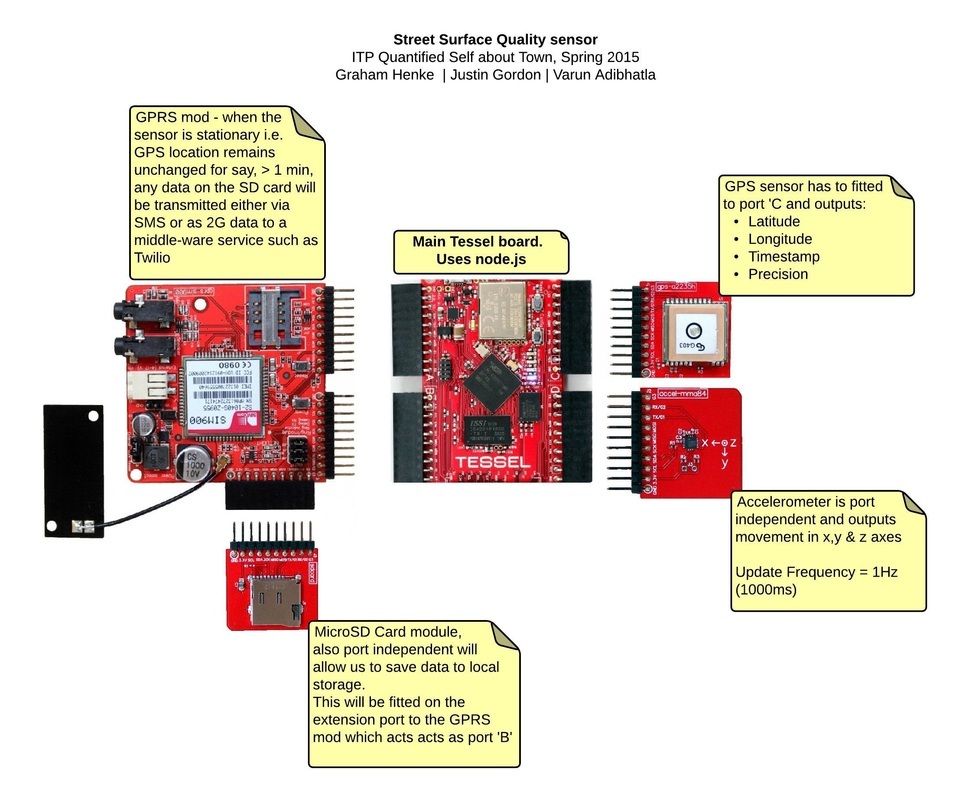
Credits to Varun for this mockup image
 RSS Feed
